What goes into a hero run? A list of terms and concepts
A "Hero Run" is a very particular kind of performance test. It has two competing goals:
- Demonstrate the file system's capacity to move bulk data. Show the file system in its best possible light.
- Honestly report the file system's performance. Avoid setting unrealistic expectations for the file system's users.
This set of terms and definitions is focused on one particular style of test. Similar sorts of details will be gathered elsewhere for alternative tests. This test uses IOR to generate a load on a Lustre file system. The amount of data moved divided by the time it takes gives a data rate for the file system. For a well constructed test meeting the two criteria above, this number, also called the file system's bandwidth, characterizes the file system as a whole.
Terms
A POSIX-based IOR test runs on one or more client nodes and has these characteristics:
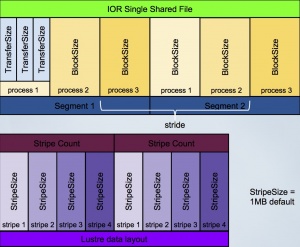
- file-per-process (as opposed to single-shared-file)
- block size - The amount of contiguous data (writing and or reading) read or written by a single task at a time. Each block may be composed of multiple 'transfer size' read/write syscalls from this task.
- transfer size - The amount of data moved in a single POSIX system call (write() or read()).
- node count - Number of clients are participating in the test.
- task count - Number of tasks participating in the test. The task count = node count X tasks per node.
- stride - The offset between two consecutive blocks from the same task
- segment - The group of blocks comprised of 1 block from each task. Segment size = stride length.
Considerations
The HPC system as a whole, including its file system, needs to be understood in detail. It has many components that need to be specified:
- How many actual disks get combined into one volume, also known as a Logical UNit or LUN?
- How many LUNs are gathered into a particular OST?
- How many OSTs are on each OSS?
- What is the nature of the storage controller, RAID type, chunk size, etc?
- How many OSS are there?
- What is the network topology, hop count, etc?
- What is the network type?
- How is a client node constructed: buses, NUMA, etc)
There are user settings to consider and document:
- Stripe size
- Stripe count
Similarly, there are administrative configuration details:
- System dirty write limit
- Per-OST dirty wite limit
- RPCs in flight
- Small file prefetch
- read ahead tunings
Environment
One should document the environment of the test:
- What system and what facility is this?
- The name of the file system
- The OS type and version (servers and clients)
- File system type and version (server and clients)
- Controller BIOS version
- IOR version
You can cut-and-paste this script onto a Unix command line:
{
 # general information about the system
 date
 uname -r
 tail -25 /proc/cpuinfo
 grep Mem /proc/meminfo
 cat /proc/mdstat
 # information about mounted filesystems
 mount -t lustre
 df -h -P -t lustre
 df -h -P -i -t lustre
 # Lustre node configuration
 lctl get_param -n nis
 lctl get_param -n version
 lctl get_param -n devices
 lctl get_param *.*.num_exports
 lctl get_param -n osc.*.checksum_type | sort -u
 lctl get_param -n osc.*.max_rpcs_in_flight | sort -u
 # IO/RPC statistics from running server threads
 lctl get_param -n *.*.*.stats | egrep -h -v "snap|req|llog" | sort
 lctl get_param -n *.*.brw_stats | egrep -B1 -A9 -m2 "bulk|I/O size"
} 2>/dev/null | tee /tmp/benchmark-survey.txt